18.3. Create New Widget
You can create a new widget from: Dashboard, Monitor’s Detail Page and Report.
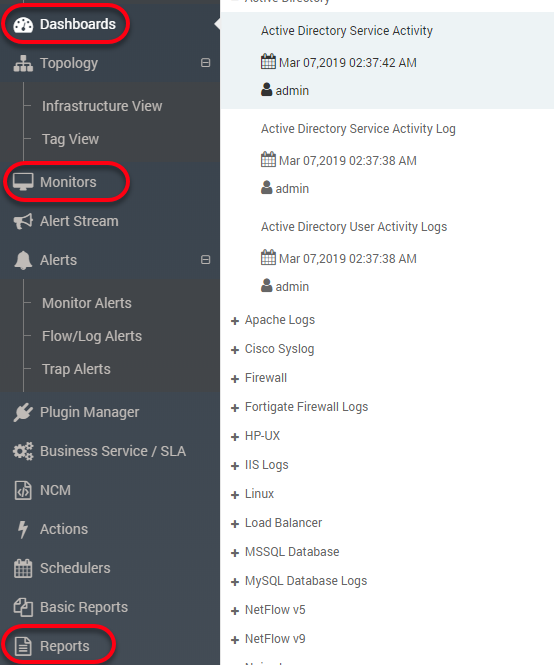
Pages to Create New Widget
18.3.1. Select a Template
Templates are the pages/placeholders that contains the widgets. Motadata provides a default range of templates with default range of widgets in each. Whenever you create a new widget, it is assigned to the template opened on your screen.
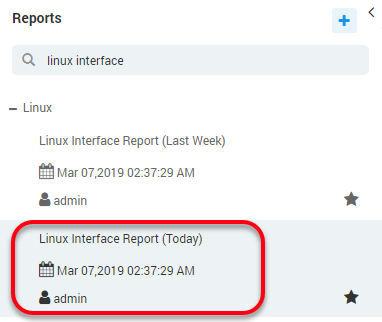
Select a Template
18.3.2. Select a Widget Category
Select a widget type to create the widget. Each widget type has a specific set of the configuration parameters and visualization output.
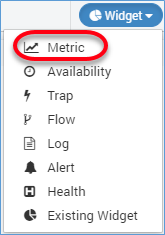
Select a Widget Category
Note: DO NOT forget to select the correct template for the widget. You cannot change the template afterwards.
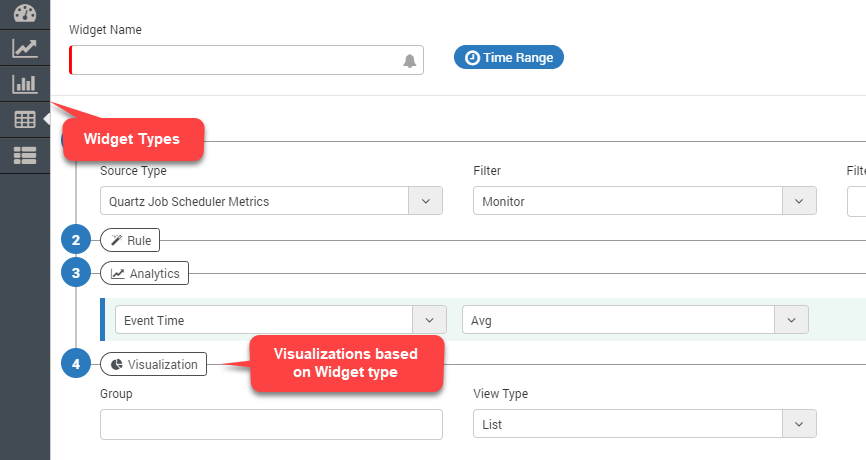
18.3.3. Select a Widget Type
From the left hand side column, select a widget type. If you are not sure which type should you use, simply navigate through all the available types and see what visualizations they are providing.
Select a Widget Category
18.3.4. Define Demographic Details
18.3.4.1. Widget Name
Type the widget name. You’ll recognize the widget using this name. Please keep a meaningful and unique name so you don’t get confused with other similar widgets.
18.3.4.2. Time Range
(Not Available for All Widgets) When you select a time range, Motadata looks into the records for that time period and show the output. This feature is useful when you want to look the data of a particular time (say today). See Time Range to understand how Motadata computes using time range.
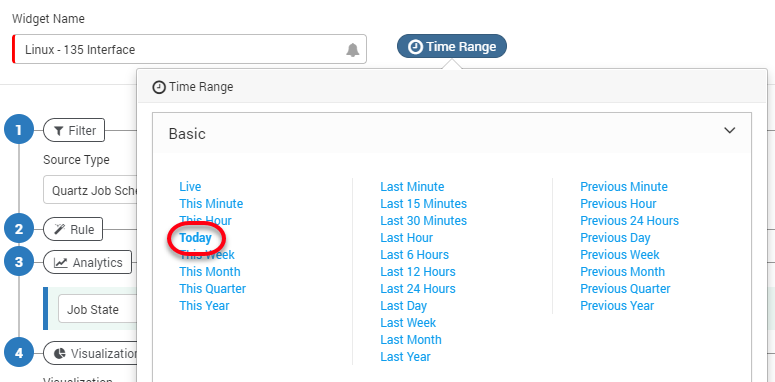
Select Time Range
18.3.5. Define Condition Filters
With filter conditions, you can define what monitor(s) or data you want to see in the widget. The filters available for a widget are dependent on the widget category selected.
18.3.5.1. Source Type
Source type is available for: Metric, Trap and Log categories. The drop-down values in the source type shows following type of values:
In Metric widget category, Motadata shows list of all metrics available in the system.
In Trap widget category, Motadata shows ‘Trap’ as the source type.
In Log widget category, drop-down shows all the sources from which Motadata collects the log.
Select the desired source type for which you want to create a widget.
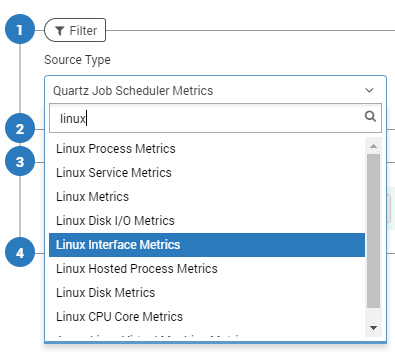
Select Source Type
18.3.5.2. Filter
Motadata uses a set of 5 filters to create the widget. However, for the Log and Trap categories, two filters: ‘Department’ and ‘Source Type’ are available.
Filter decides how Motadata will identify the monitors of your selected source type. You can choose one of the following methods:
Tag - Use the monitor tags to find a monitor.
Monitor - Use the IP address to find a monitor.
RPE - Look for monitors polled by an RPE.
Department - Look for monitors of a given department.
Source Host - Use the IP address of source monitors from which logs and flow are coming.
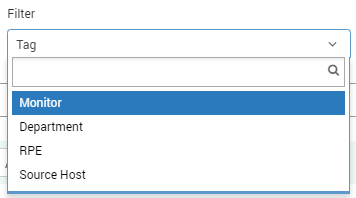
Select a Filter
18.3.5.3. Filter Values
Motadata shows filter values based on the filter you have selected. The filter values work as follows:
Tags: When you select filter as a tag, the list shows all the tags available for that source type. Motadata will choose all the monitors of the selected tags for the widget.
Monitor: When you select filter as a monitor, the list shows IP address/monitor names available for that source type. Motadata will choose all the selected monitors for the widget.
RPE: When you select filter as a RPE, the list shows all the RPEs that are polling monitors for that source type. Motadata will choose all the monitors getting polled from the selected RPE for the widget.
Department: When you select filter as a department, the list shows all the Departments that are linked to the monitors for that source type. Motadata will choose all the monitors associated with the selected departments for the widget.
Source Host: When you select the source host, the list shows all the IP addresses for that source type. Motadata will choose all the monitors under that source type for showing widget output.
Blank: When you select nothing in the include drop-down (leaving it blank), Motadata will choose all the monitors for that source type.
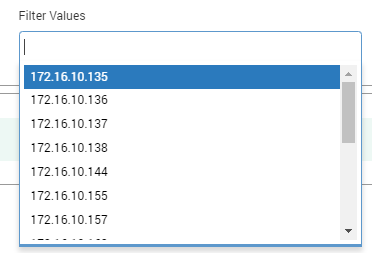
Select a Filter Value
18.3.5.4. Instance Type
Available for Availability, Alert and Health category of widgets. The instance type can be:
None: Motadata will fetch information at the monitor level. For ex: you can check how many monitors are in ‘up’ ‘down’ or in ‘maintenance’ mode.
Interface: Motadata will look into the available interfaces of the monitor. For ex: A port of the network device. You can create a widget to show how many ports are in ‘up’ and ‘down’ mode.
Service: Motadata will look into the available services of the monitor. For ex: an application running in windows machine. You can create a widget to see how many applications are in ‘up’ or ‘down’ mode.
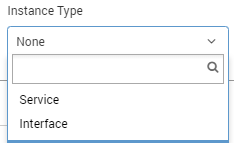
Select an Instance Type
18.3.5.5. Instance Filter
Instance filter is available for: Metric, Availability, Alert and Health widget categories. It gives you a choice to select an instance for all the monitors or for a single monitor. The instance filter has two values:
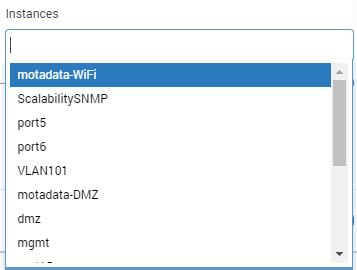
Instance: It lets you choose the instance. Motadata will consider all the monitors having that instance.
Monitor: It lets you choose the instance of a monitor. Motadata will consider the selected instance of the selected monitor only.
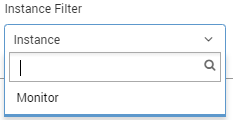
Select an Instance Filter
18.3.6. Define Filter Rules
Rules help you to create the widget with specific parameters of the monitors. You can select the rules if you want to add conditions for granular output. For example: you can create widgets whose CPU consumption is greater than 60%. To create such conditions:
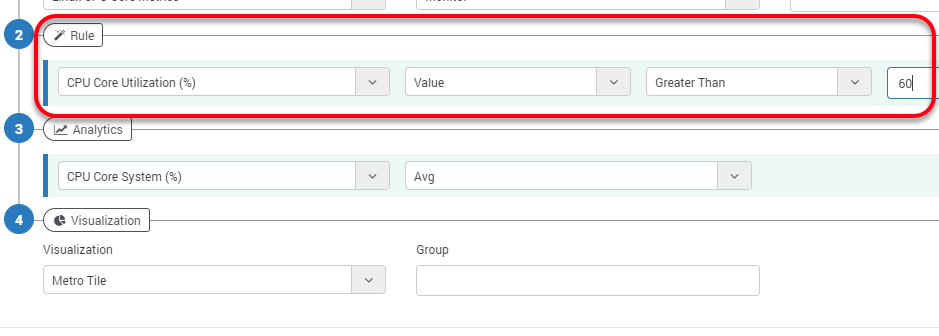
Define Filter Rules
18.3.7. Set Analytics
With analytics you can define the exact outputs of the widget. For example in a table widget, you can define the columns using analytics. Also, you can define how the values are calculated in the widget.
Other option is also available for enabling multiple analytics for the exact outputs using the same values multiple times.
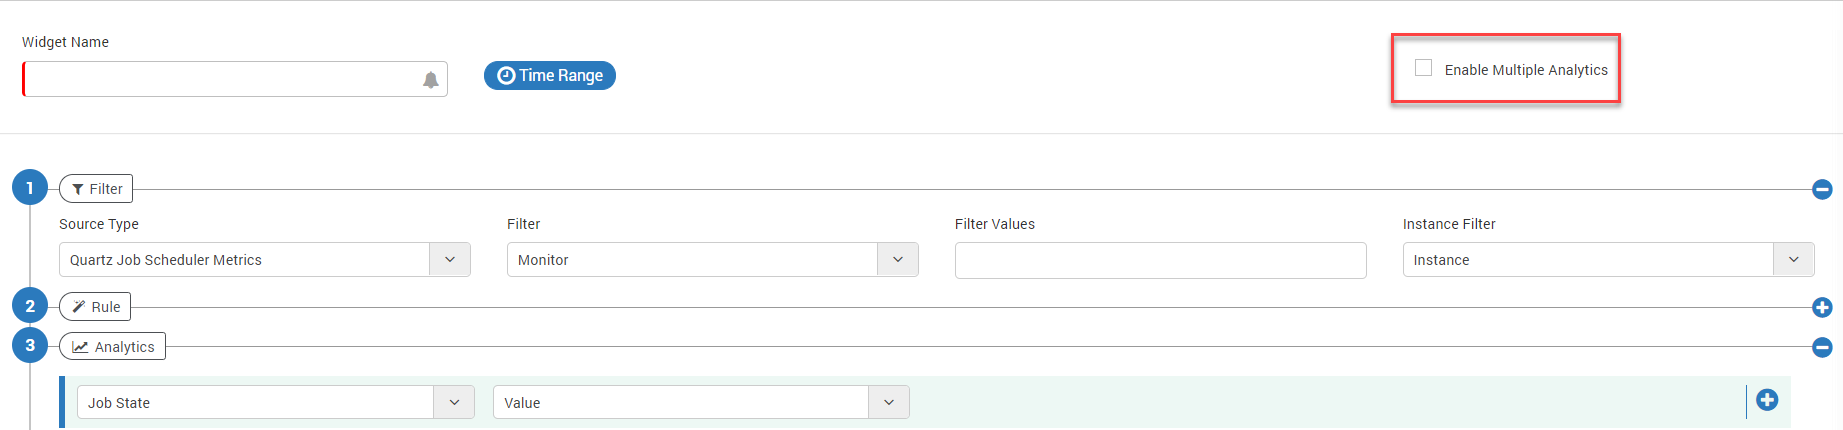
Enable multiple Analytics
When you Enable this flag, you can use the same values multiple times. If you wish to use the single values, keep the flag disabled. By default the flag is ‘Disabled’.
For the Linux monitors, Motadata has a default widget to show the system processes. The widget uses following visualization:
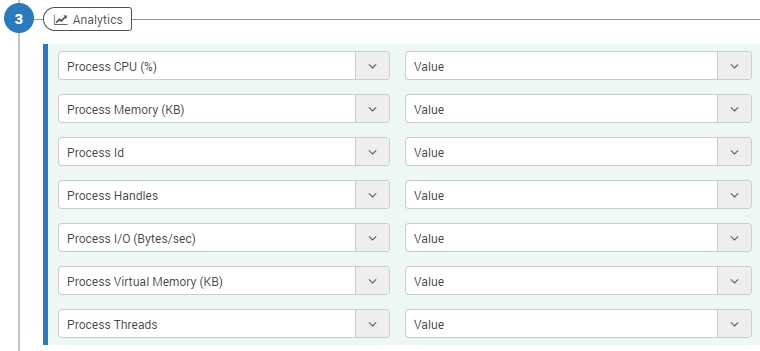
Define Analytics
Here is the output of the above analytics:
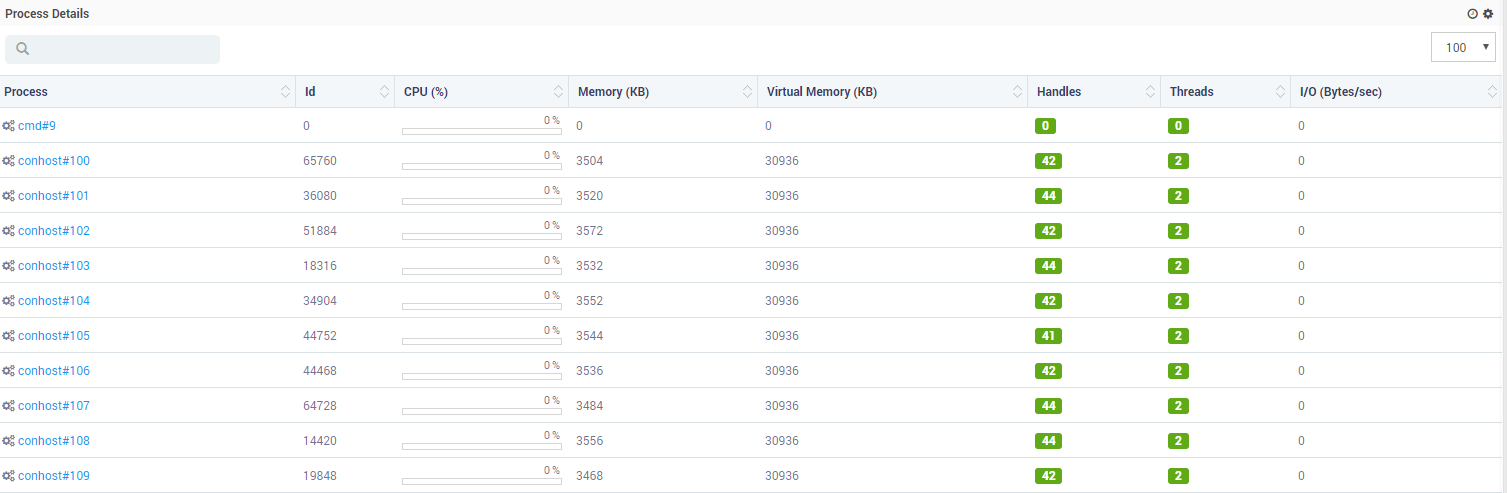
Sample Output of Analytics